How the Code Functions
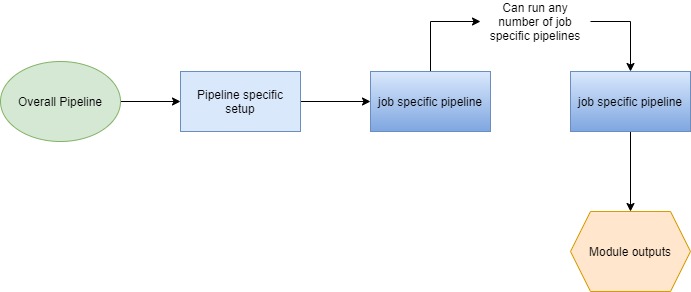
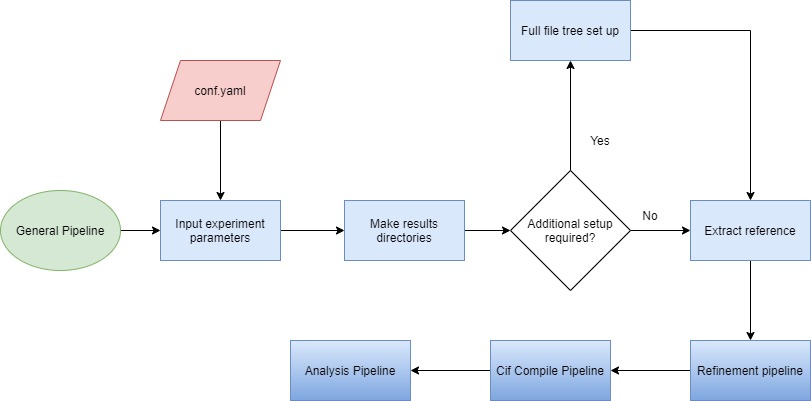
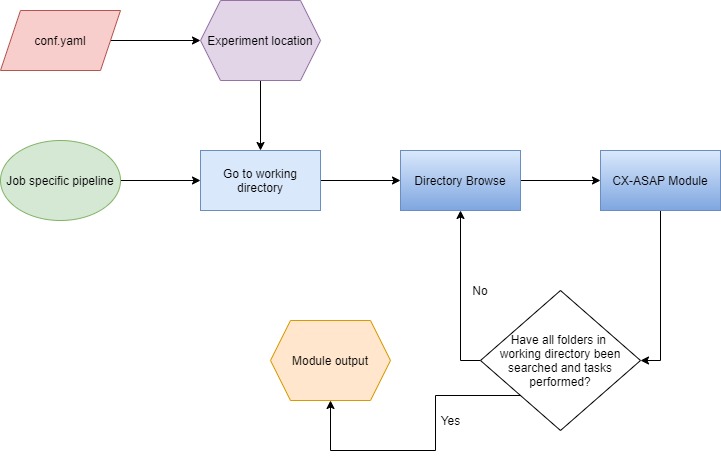
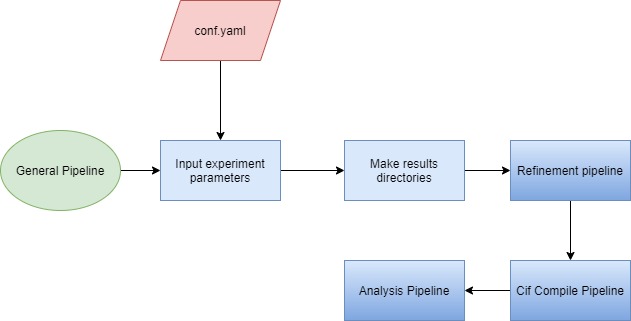
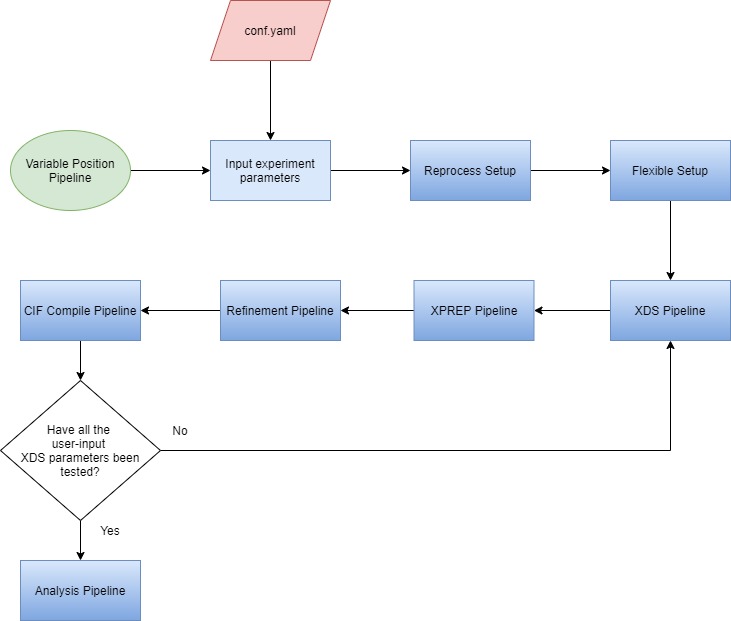
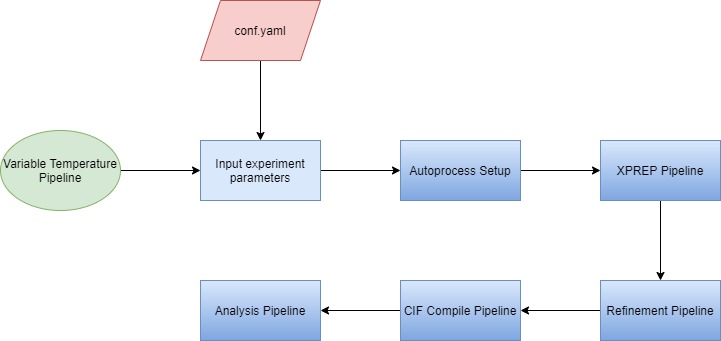
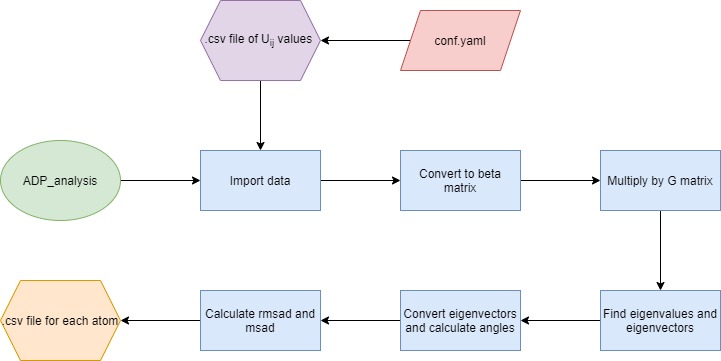
This page contains a series of flow charts which describe how various modules and pipelines function. Module flow charts show how the classes perform their required functions, and pipeline flow charts show which modules are called within the pipeline.
Legend
The meanings of the different symbols used in the flow charts are defined below:
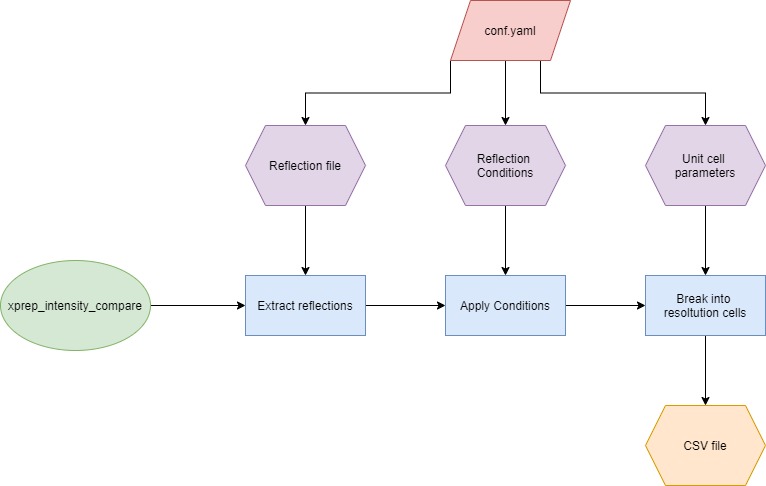
Green Oval - Start of module/pipeline Purple Hexagon - Input Orange Hexagon - Output Red Parallelogram - CX-ASAP file Blue Rectangles - Plain - Process or algorithm Blue Rectangles - Gradient - Process imported from CX-ASAP White Double Rectangle - External program White Diamond - Decision made by CX-ASAP
Modules
ADP Analysis Module
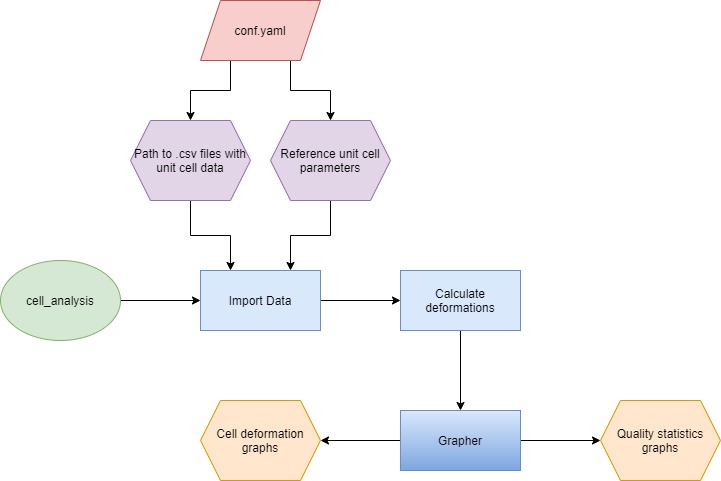
Cell Analysis Module
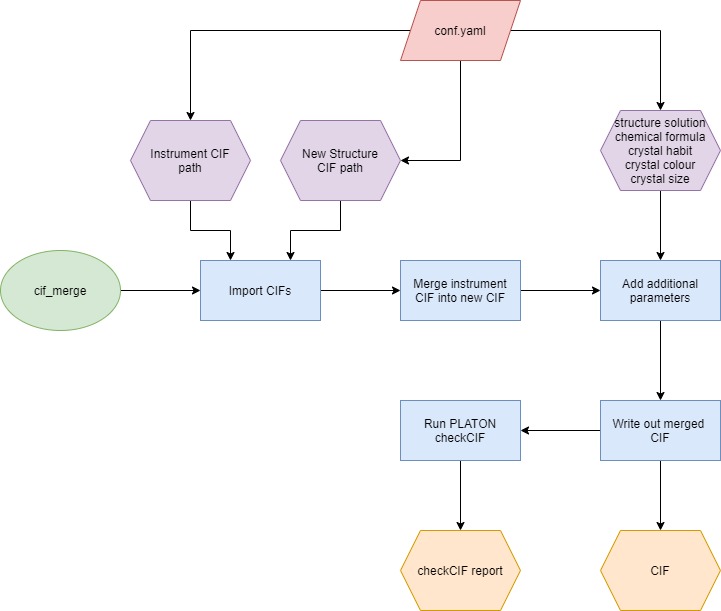
CIF Merge Module
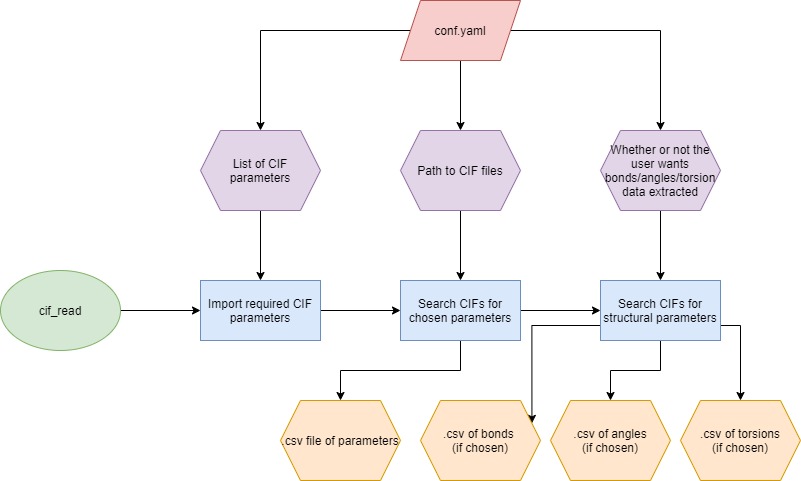
CIF Read Module
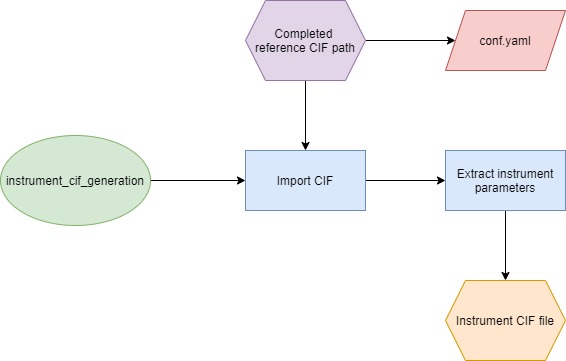
Instrument CIF Generation Module
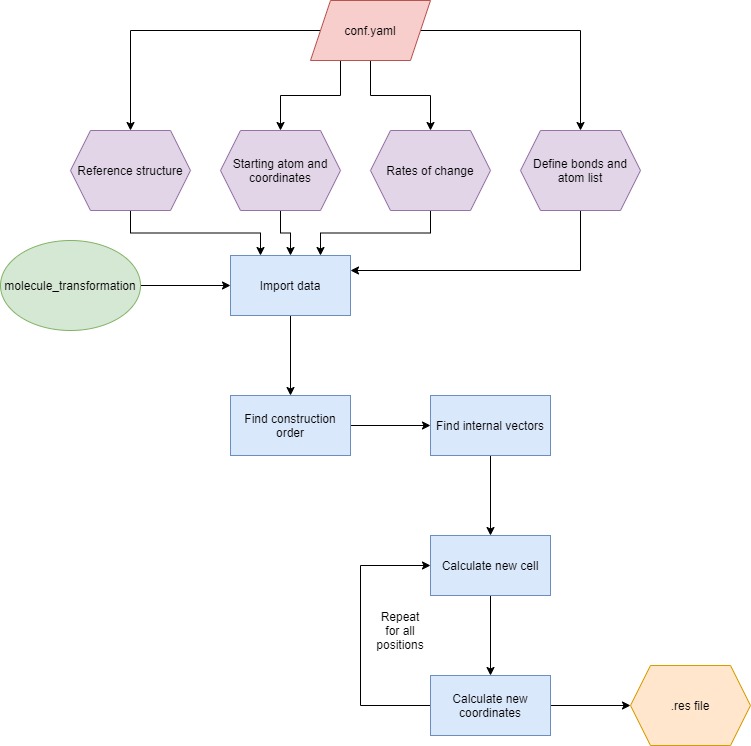
Molecule Transformation Module
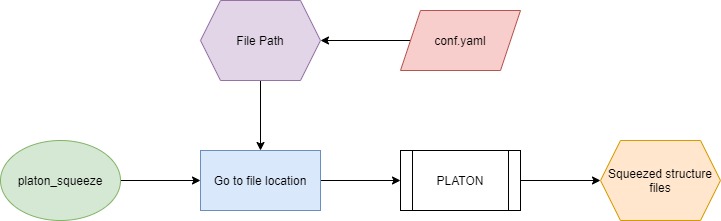
PLATON Squeeze Module
Refinement Module
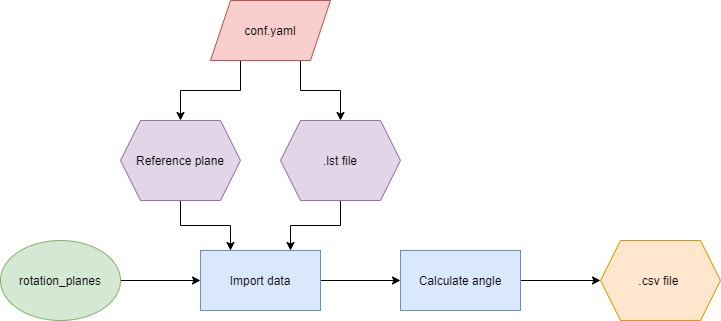
Rotation Planes Module
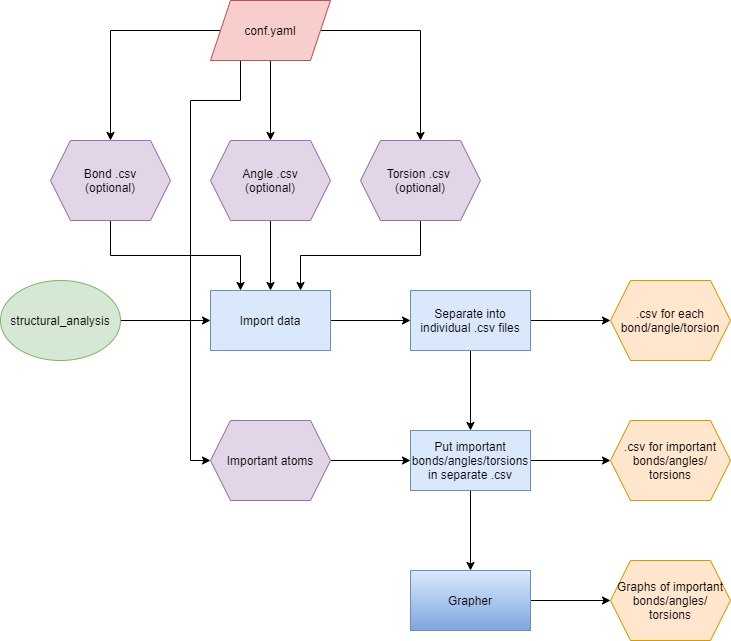
Structural Analysis Module
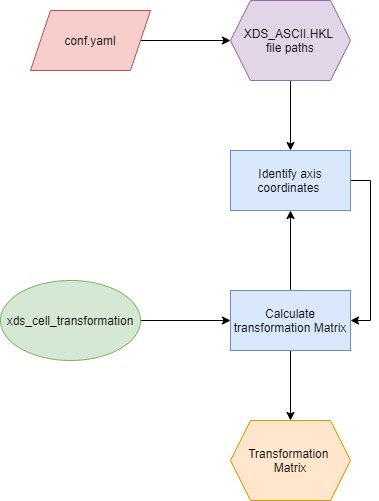
XDS Cell Transformation Module
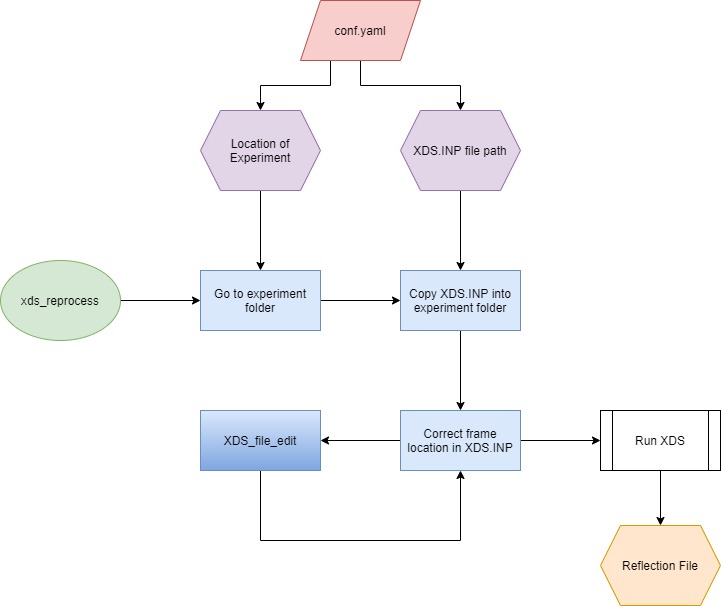
XDS Reprocess Module
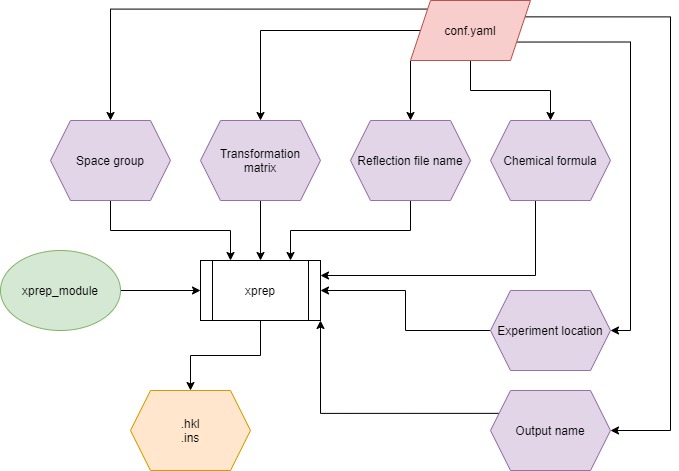
XPREP Module
XPREP Intensity Comparison Module